My Research
Below are a set of key papers from my research, written in plain language. Please contact me if you have any questions!Neuroscience
New neuroscience datasets a full of fascinating and complex patterns, that provide clues as to how we are able to make sense of the world around us.
Overcoming false-positive bias in gene-category enrichment (2021)
Overcoming bias in methods for analysing gene-expression atlases.
Ben D. Fulcher, Aurina Arnatkeviciute, Alex FornitoOvercoming false-positive gene-category enrichment in the analysis of spatially resolved transcriptomic brain atlas data
Nature Communications (2021).
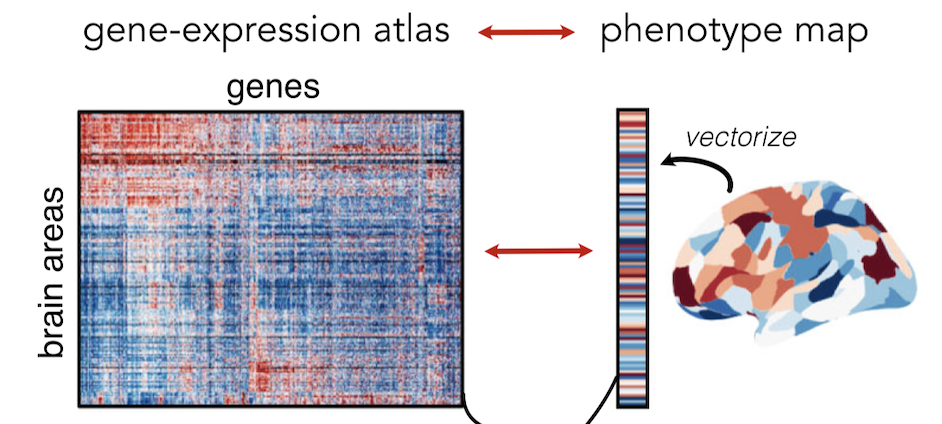
Recent work has measured whole-brain maps of brain chemicals at a truly staggering resolution, down to the individual cell! Since these maps have been made available to the community, the race has been on to connect these chemical patterns to the differences in brain structure and function that they may contribute to. In this paper, we showed that the methods that researchers have used to do these types of analyses contain biases that are likely to have affected the validity of prior work. For example, we found that some existing methods yield a surprisingly high rate of reporting significant relationships to purely random data . We uncover the cause of the problems and introduce new improvements that overcome the statistical shortcomings. We hope that the improvements we develop will allow researchers to find out more about how the brain's circuits at the microscopic scale come together to form a complex whole that underlies our conscious experience of the world .
A summary article is here.
Multimodal gradients across mouse cortex (2019)
Humans and mice share common brain structures.
Ben D. Fulcher, John D. Murray, Valerio Zerbi, Xiao-Jing WangMultimodal gradients across mouse cortex
PNAS (2019).
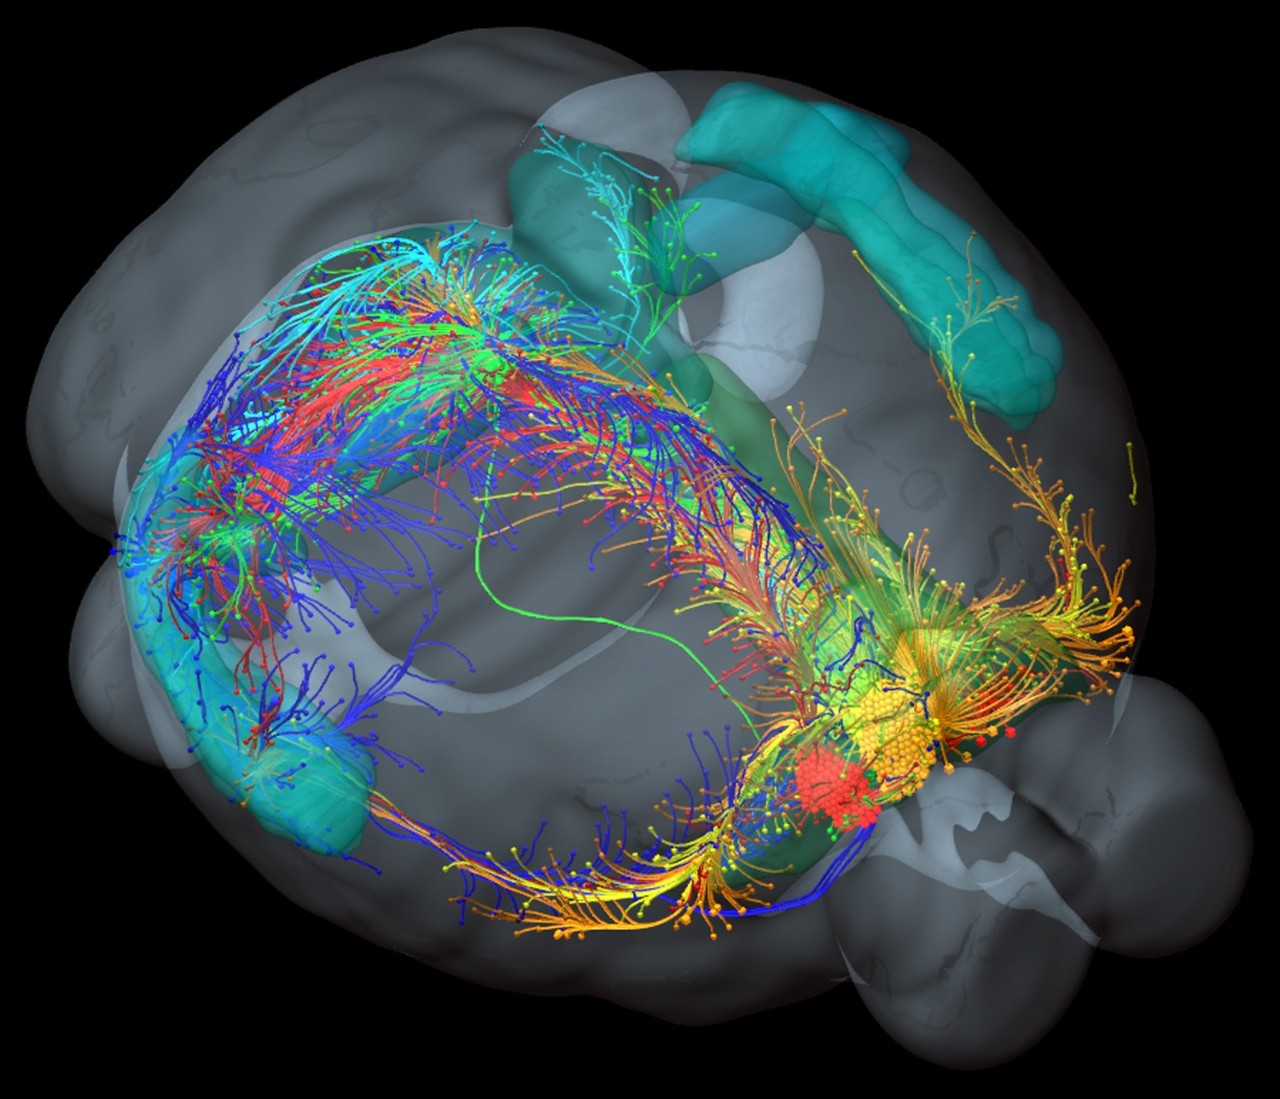
The human brain is capable of a dizzying array of cognitive functions, and is ultimately responsible for all of our thoughts, feelings, and emotions. But how much of this is distinctively human? To probe this, we need to look inside the brain, at the anatomical structures that lie beneath our ability to make sense of the world around us. Lots of research has looked at how the brain’s circuits are specialised for different functions in the human brain, like how the parts of the brain that process vision differ from the parts that integrate lots of diverse information, like our emotions and memories. Looking for the same variation in the mouse brain, researchers have found surprisingly little variation, suggesting that the human conscious experience may be, at least in part, driven by the specialisation of neural circuits that evolved with the expansion of the primate cortex.
We wanted to test whether this principle of brain organisation is unique to humans, or whether it may apply across species. To do this, we analysed lots of data from intricate mouse brain-mapping experiments, giving us an unprecedented insight into how neural circuits are organised. Note that we didn't need to collect any data, instead we took data from other friendly scientists from across the world. Thanks scientists . We found that the mouse brain's circuits vary along the path of information flow in a similar way as had been observed in highly specialised human brains . That is, properties thought to be unique to the human brain are also shared by the mouse brain. Our results question the uniqueness of the human brain, and provide clues to how the brain’s structure has evolved to facilitate efficient information processing.
A University of Sydney media release summarizing our results is here.
Hub connectivity, neuronal diversity, and gene expression in the Caenorhabditis elegans connectome (2018)
Highly connected neurons in the worm's nervous system have distinctive gene-expression patterns
Aurina Arnatkeviciute, Ben D. Fulcher, Roger Pocock, Alex FornitoHub connectivity, neuronal diversity, and gene expression in the Caenorhabditis elegans connectome
PLoS Computational Biology (2018).
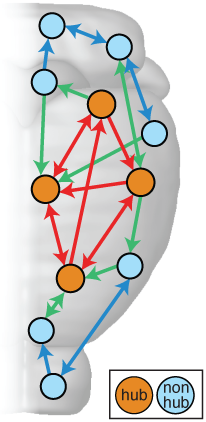
C. elegans is a transparent roundworm, that is about 1 mm long and contains 302 neurons. It is the only organism for which we have a complete map of how every one of its neurons connects to every other neuron (thanks to incredible microscope work done in 1986). Modern technology has allowed unprecedented detail into C. elegans, with an ability to measure which genes are expressed in different cells, and even record (in real time) the complex interplay of neural activity that makes this roundworm engage in different behaviors. These amazing techniques have produced unprecedented datasets that scientists share openly with each other and the public, with the promise of working collaboratively to understand neurons: the tiny cells that are responsible for our ability to sense, process, and respond to information from the world around us. In this work, we used some of this data to understand whether the relationship between how genes are expressed across neurons is related to how those neurons are connected to each other, and whether this relationship mirrors that that we measured on a much larger scale in the mouse brain.
Our analysis reveals that the most highly connected neurons in C. elegans, which are known to be responsible for controlling movement, have the most similar patterns of gene expression. These patterns match with what we measured in the mouse brain. This consistency across very different species and on vastly different scales, suggests that this connection between how neurons are connected and the molecular programs that control their function, may be characteristic property of evolved neural systems. Future work in other animals (such as humans), and with ongoing improvements in the quality of the data we measure, will allow us to better understand the functional role of these unique and highly connected hub neurons. All of the data we used and processed are freely available here, and analysis code to reproduce our calculations is here.
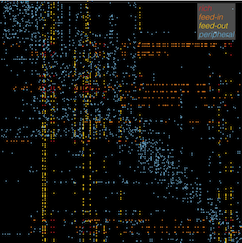
The dynamics of brain activity relate to brain connectivity (2017)
Highly connected brain areas display slower activity fluctuations
Sarab S. Sethi, Valerio Zerbi, Nicole Wenderoth, Alex Fornito, and Ben D. FulcherStructural connectome topology relates to regional BOLD signal dynamics in the mouse brain
Chaos, (2017). [Open access preprint version is here]
Connections in the brain are like a complex web of wires that allow different brain areas to communicate to each other. We know that different brain areas have different functions, and that the function of a brain region may be related to the connections it makes to other brain areas. Brain imaging has allowed us to measure the activity fluctuations of brain areas over time, and the properties of these fluctuations have been shown to be distinctive of different brain areas, and even as a signature to classify individual subjects (like a unique 'fingerprint' of your own resting brain activity). In this work, we wanted to explore whether a brain area's connectivity properties are related to its activity fluctuations at rest.
To do this, we analyzed a massive database of brain connectivity data from the Allen Mouse Brain Connectivity Atlas, and paired it with experimental measurements of brain activity of anesthetized mice, measured in a lab in Zürich, Switzerland. We found that brain regions that make many strong connections (particularly incoming connections) display characteristically slower activity dynamics. By identifying and quantifying this relationship for the first time, we reveal a new piece of the puzzle of how the brain is organized. Future work will look to determine whether this relationship holds in other species, and hence whether it might reveal clues about deeper organizing principles of the brain.
The mouse brain contains energy intensive hub regions (2016)
Connections involving highly connected brain regions are associated with a characteristic gene expression signature
B. D. Fulcher, A. FornitoA transcriptional signature of hub connectivity in the mouse connectome
Proceedings of the National Academy of Sciences, USA (PNAS), (2016) [open access].
In this work, we analyzed a massive database of brain connectivity data from the Allen Mouse Brain Connectivity Atlas, which contains data from experiments where researchers inject viral tracers into different regions of the mouse brain. The tracer then follows the fibers connecting the brain (known as axons) to reveal the set of brain regions connected to that target region. These data allow us to understand how this web of brain interconnectivity is structured.
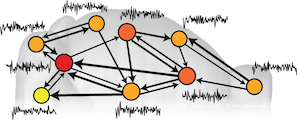
Consistent with previous work looking at the brains of worms, cats, macaques and humans, we found that the mouse brain is not wired randomly, but contains a small number of 'hub' brain regions, containing a large number of connections to the rest of the brain. Our thoughts, feelings, and consciousness rely on the brain integrating diverse information across different specialized brain regions (such as those involved in vision or memory). But how does the neural information from one brain area combine with that from another, different brain area? This integration of information is thought to occur across the brain's network of connections via these highly connected 'hubs' of the brain -- much like a large proportion of air passengers fly across the world via the hubs of the air transportation network (such London Heathrow and JFK).
Having confirmed the presence of hubs in the mouse brain, we then investigated whether they were associated with some distinctive genetic signature. The expression of genes involves reading part of your DNA to produce a particular molecule, and different parts of the body (including different parts of the brain) produce different molecules to function. If brain connections are like the 'hardware' connecting different regions of the brain, then this gene expression is kind of like the 'software' running at each brain region. We built up a picture of the expression levels of over 17,000 genes in each of 213 brain regions (like a massive barcode containing 17,000 numbers), and then measured the similarity of all pairs of brain regions by how similar these gene expression barcodes were. This is like asking the question: which pairs of brain regions are running the most similar software? Could it be those involving hubs?!
Firstly, and unsurprisingly, we found that pairs of brain regions that were structurally connected had more similar gene expression barcodes than pairs of brain regions that were not connected. The genes ('software programs') that best explained this similarity were involved in general aspects of brain communication (the function of brain cells called neurons), which makes perfect sense, because these are pairs of brain regions that communicate with each other. But are different types of connections distinctive -- say, for example, the connections involving the important brain hubs? We found that yes: the pairs of brain regions with the most similar gene expression barcodes were indeed pairs of hubs. Furthermore, the genes driving this similarity were those controlling the production of energy required for brain signalling, providing evidence for the idea that connections between hubs carry a large amount of signal traffic across the brain (which is energy intensive).
Our findings suggest that not all brain connections are equal -- connections involving brain network hubs have a highly distinctive pattern of gene expression, marking hubs as energy hungry control centers of the brain. This suggests that the association between brain disorders and dysfunction of brain network hubs may be related to the regulation of energy that is required to meet the high activity requirements of these critical brain areas.
The Monash University media release for this work is here.
Time series
A time series is the result of measuring something repeatedly over time. Imagine taking repeated measurements of the position of a leaf flickering in the wind, or the value of a share on the stock exchange, or the electrical activity generated by your heart. All of these measurements change over time, producing interesting patterns. These patterns can be really useful to understand, because they may allow you to determine if patterns in the electrical activity of your heart is abnormal, or help you to predict the future value of something like the weather, or a share price. These sorts of tasks, of finding patterns in observations over time, are known as time-series analysis.

Time-series analysis is an art. People modeling the patterns in economic quantities (like inflation or unemployment) have their own set of 'paintbrushes' and techniques, as do biomedical researchers trying to find abnormal patterns in the sleep recordings of patients, or their heart rhythms, or unusual tremors in their voice (that might indicate risk for Parkinson's disease). Indeed, people working in industry (monitoring production lines), the stockmarket (analyzing fluctuations in the markets), as well as scientists across the disciplines (from astrophysicists and climate scientists through to statisticians and mathematicians), all have their own way of analyzing the same fundamental thing: patterns in a set of measurements taken over time.
My research involves bringing together all of these different ways of thinking about time series and asking questions like the following: "How do the techniques used by astrophysicists differ from those used by biomedical researchers?", "If I have a new recording of some quantity over time and I want to understand what sort of patterns exist in it, which method should I use?" We have assembled a 'library' of thousands of such analysis measures to answer such questions, and have developed algorithms for automatically finding the best 'books' in this library for a given task. This library turns out to be very useful, as it provides a way of automatically searching for the most important types of patterns in a given set of recordings.
Highly comparative time-series analysis (2013)
What sorts of time-series data do scientists collect, and how do different types of scientists analyze their time-series data?
B. D. Fulcher, M. A. Little, and N. S. Jones.Highly comparative time-series analysis: the empirical structure of time series and their methods.
Journal of the Royal Society Interface, 10(83), 20130048 (2013).
This article represent the main work of my PhD, bringing together and comparing thousands of time-series analysis methods and their behavior on tens of thousands of time series. Time series were collected from open data repositories and include outputs from time-series models, noisy astrophysics measurements, or recordings of physiological processes. For each time series, we calculated over 9000 operations, quantifying different types of properties, including fitting linear models, estimating the correlation dimension, and calculating the Approximate Entropy. By synthesizing large libraries of data and methods and using the behavior of each to organize the other, we are thus able to investigate the empirical structure of time series and the approaches that scientists have developed to analyze them.
We are constantly interacting with signals in the world around us: noticing the fluctuating breeze against our faces, observing the intermittent flickering of a candle, or becoming absorbed in the regularity of one’s own pulse. Researchers across science have developed highly sophisticated methods for understanding the structure in these types of time-varying processes, and identifying the types of mechanisms that produce them. However, scientists collaborate between disciplines surprisingly rarely, and therefore tend to use a small number of familiar methods from their own discipline. But how do the standard methods used in economics relate to those used in biomedicine or statistical physics?
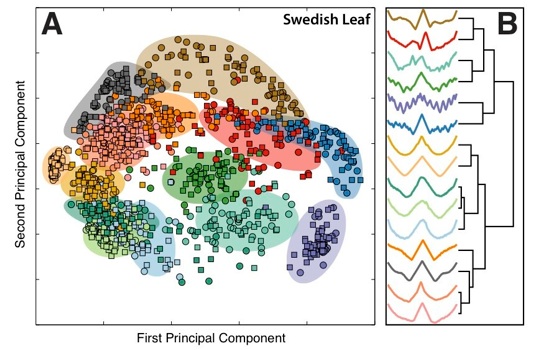
In this article, we investigated what can be learned by comparing such methods from across science simultaneously. We collected over 9,000 scientific methods for analysing signals, and compared their behaviour on a collection of over 35,000 diverse real-world and model-generated time series. The result provides a more unified and highly comparative scientific perspective on how scientists measure and understand structure in their data. For example, we showed how methods from across science that display similar behaviour to a given target can be retrieved automatically, or how different real-world or model-generated data with similar properties to a target time series can be retrieved similarly. Further examples of the kinds of questions we ask are in the boxes in the figure below. The result provides an interdisciplinary scientific context for both data and their methods. We also introduced a range of techniques for exploiting our library of methods to treat specific challenges in classification and medical diagnosis. For example, we showed how useful methods for diagnosing pathological heart beat series or Parkinsonian speech segments can be selected automatically, often yielding unexpected methods developed in disparate disciplines or in the distant past.
We have developed a freely-available code package for performing this type of highly comparative time-series analysis, and launched a web platform, Comp-engine time series, to aid interdisciplinary collaboration on time-series analysis. These resources will allow people to exchange time-series data and analysis code to encourage interdisciplinary comparisons and ensure real progress is being made in the time-series analysis across the sciences.
Classifying different types of time series (2014)
What properties distinguish two signals from each other?
B. D. Fulcher and N. S. Jones.Highly comparative feature-based time-series classification.
IEEE Transactions on Knowledge and Data Engineering, 26(12), 3026–3037 (2014).
We are constantly observing ordered patterns all around us, from the shapes of different types of objects (think of different leaf shapes, yoga poses), to the structured patterns of sound waves entering our ears and the fluctuations of wind on our faces. Understanding the structure in observations like these is important: e.g., making sense of the patterns in heart beat intervals helps medical diagnosis, and understanding patterns of credit card transactions can help detect fraudulent ones. We published an article that automatically learns the patterns that you should measure in these types of datasets---e.g., what is it about production-line sensor measurements that predict a faulty process, or what is it about the shape of Eucalyptus leaves that distinguish them from other types of leaves?
Conventional methods for comparing these types of measurements taken through time (or time series) involve comparing their values through time, often using sophisticated methods (with science fiction names like "dynamic time warping") that squeeze together pairs of time series to find the best match. This approach can be extremely powerful, allowing new time series to be classified (e.g., in the case of a heart beat measurement, labelling it as a "healthy" heart beat or a "congestive heart failure"; or in the case of leaf shapes, labelling it as "Eucalyptus", "Oak", etc.), by matching them to a database of time series with known classifications. While this approach can be good at telling you whether your leaf is a "Eucalyptus", it does not provide much insight into what it is that makes Eucalyptus leaves distinctive. It also requires one to compare your new leaf to all the other leaves in your database, which can be an intensive process.
Our method involves comparing thousands of different time-series properties simultaneously (cf. Comp-engine time series) to find those patterns that best distinguish a given type of data. The patterns allow a scientist to interpret what is distinctive about a given type of measurement (be it unhealthy heart rhythms or Eucalyptus leaves) and new time series (e.g., heart rhythms or leaf shapes) can then be classified rapidly. Our framework is general and can be used to understand differences between heart beat intervals, industrial sensors, yoga poses, rainfall patterns, etc. and helps data science / big data / time-series data mining people deal with ... bigger data.
Predicting blood pH of newborns from fetal heart rate recordings (2012)
Can computers analyze fetal heart rates to inform intervention during labour?
B. D. Fulcher, A. Georgieva, C. W. Redman and N. S. JonesHighly comparative fetal heart rate analysis
Engineering in Medicine and Biology Society (EMBC), 2012 Annual International Conference of the IEEE, pp. 3135–3138 (2012).
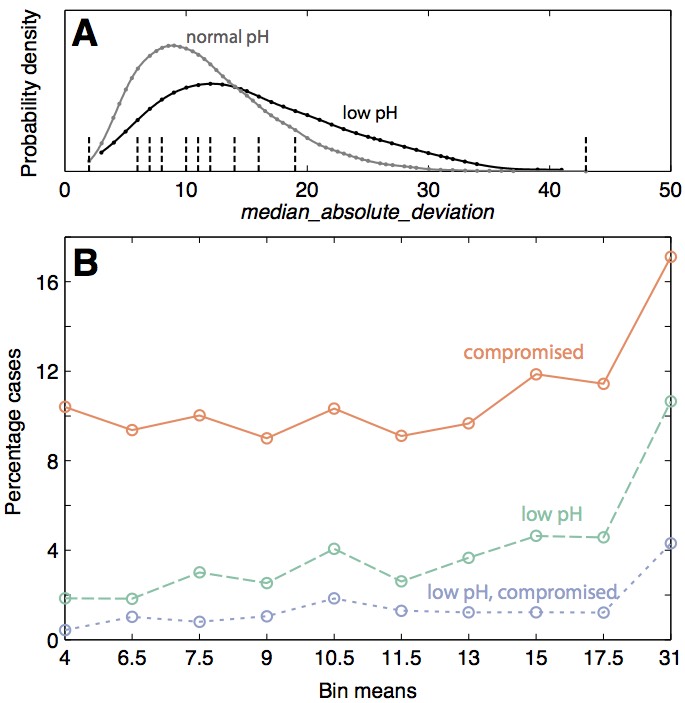
During birth, a baby’s oxygen supply can be compromised and cause suffocation and lead to seizures, permanent brain damage, and the death of the newborn. Interventions can prevent these complications, but come at the risk of other types of complications and would ideally be avoided. In this work, we compared the behavior of thousands of time-series analysis methods on fetal heart rate recordings to see if they might be able to help guide the decision about whether or not to intervene during labour. Currently, the decision is made by experts in the room, and is considered a bit of an art, with different experts making different judgements given the same data; we hoped that a computer program might be able to help make a more objective and optimal decision given a large amount of data (over 7000 fetal heart rate recordings). We found that some features of fetal heart rate data collected during labour were informative of the resulting health of the baby at birth. Ongoing work is investigating whether these features, combined with a range of other measures used in fetal heart monitoring, may be able to provide an objective measure with which to guide the safe delivery of babies.
Sleep Research
I worked in the School of Physics at the University of Sydney from 2007--2008, and also early in 2013, researching physiologically-based sleep dynamics.Understanding the impact of stimuli during sleep (2008)
How do we respond to stimuli (such as apneas, loud noises, etc.) during sleep?
B. D. Fulcher, A. J. K. Phillips, and P. A. RobinsonModeling the impact of impulsive stimuli on sleep-wake dynamics
Physical Review E, 78, 051920 (2008).
The Phillips-Robinson model, developed in 2007, is based on the flip-flop between the mutually inhibitory sleep-active VLPO and wake-active monoaminergic brainstem and hypothalamic neuronal populations. This core physiology can be captured by three coupled ordinary differential equations.
We developed a framework for simulating short-timescale stimuli in the Phillips-Robinson sleep-wake model. The framework motivates a natural definition of the arousal threshold, as strength of an arousing stimulus that is required to wake the system from sleep. The model simulations match some reports of arousal threshold data through the night.
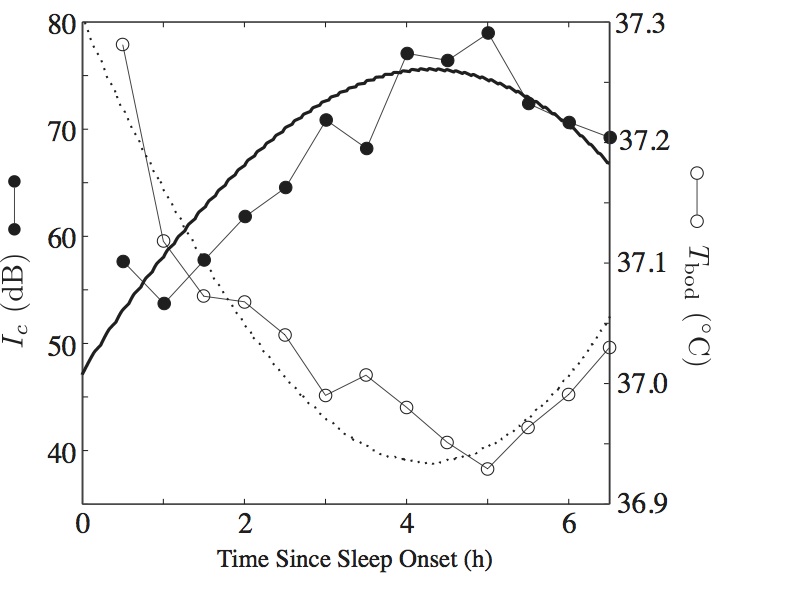
Sleep deprivation (2010)
Can we understand sleep deprivation in terms of simple interactions between brain areas?
B. D. Fulcher, A. J. K. Phillips, and P. A. Robinson.Quantitative physiologically based modeling of subjective fatigue during sleep deprivation.
Journal of Theoretical Biology. 264:407 (2010).
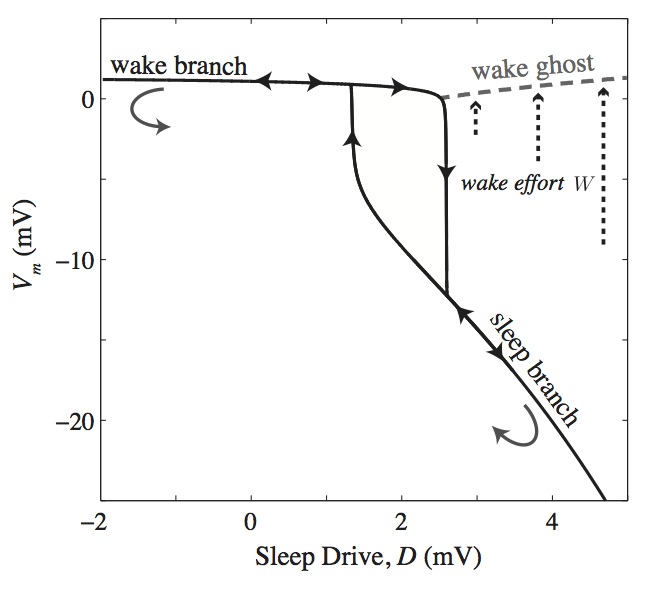
Normal sleep-wake dynamics involve an oscillation of the sleep drive, D, causing transitions between wake and sleep, with the threshold for a wake-to-sleep transition at a higher drive, D, than the transition from sleep to wake. However, a waking ghost state exists at high drive, D (due to what is called a saddle-node bifurcation in dynamical systems theory), where the system can remain awake beyond the normal wake-to-sleep transition. This wake ghost is important for sleep-wake dynamics, as it represents a metastable waking state available during normal sleeping times.
By holding the system in the wake ghost during normal sleeping hours, wakefulness can be maintained with a small additional drive, which we term wake effort and simulate it physiologically as an excitatory drive to the MA populations. The result allows us to simulate sleep deprivation experiments where we can match the variation of several clinical variables, including adrenaline production and subjective fatigue (see figure).
A computational model of narcolepsy (2014)
A simple model of the orexin system in the brain (thought to underly narcolepsy) produces dynamics consistent with the disorder
B.D. Fulcher, A. J. K. Phillips, S. Postnova, P. A. Robinson.A physiologically based model of orexinergic stabilization of sleep and wake.
PLoS ONE 9. e91982 (2014).
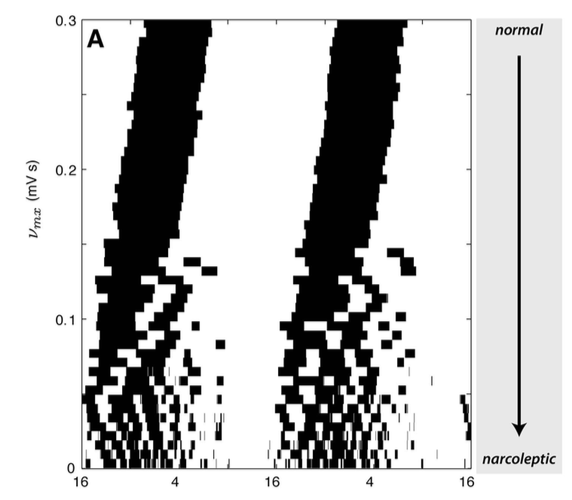
This work involved developing a mathematical model for how a recently-discovered population of neurons, called 'orexins', regulate sleep-wake dynamics. It has been observed that the loss of these neurons causes a sleep disorder called narcolepsy, a disorder characterized by severe instability of sleep and wake states. People with narcolepsy often wake up during normal sleep periods, and nap during normal waking periods, leading to general drowsiness and a difficulty waking properly from sleep. Thus, while it is known that orexin stabilizes sleep and wake, the mechanisms through which it achieves this are not well understood.
This work presents a quantitative model of the key interactions between the orexins, the other populations of neurons that regulative sleep, known as the sleep-wake switch, and the role of the circadian and homeostatic sleep drives. The model provides an interpretable explaination of how the presence of orexin stabilizes the sleep-wake switch, and thus why its loss would destabilize the sleep-wake switch. Because the model is mathematical, it allowed us to simulate the loss of orexin neurons on a computer (the figure on the left, where clock time is on the x-axis, and the relative proportion of orexin is on the y-axis, and sleep periods are black). The behavior produces by the simulation resembled narcolepsy as the amount of orexin in the model was reduced: including frequent transitions between states, reduced waking arousal levels, and a normal daily amount of total sleep. Our model thus provided a new explanation of how orexin stabilizes prolonged episodes of sleep and wake, and made a range of new, concrete predictions (such as a role of orexin in chronotype and sleep inertia).
Other projects
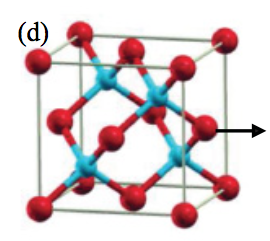
Predicting the hardness of new materials (2012)
Can we use computers to predict how hard different materials (that may not yet exist) are going to be?
B. D. Fulcher, X. Y. Cui, B. Delley, and C. Stampfl.Hardness analysis of cubic metal mononitrides from first principles.
Physical Review B, 85(18), 184106 (2012).